Public Perception of Cycling Safety in NYC
By tyler foresta, university at buffalo
Advisors: Irina Benedyk, University at Buffalo
Project Objectives
• Why are safety perceptions of cycling intensifying despite cyclist risk decreasing?
• Negative perception of cycling can lead to infrastructure being underutilized
Data and Results
• Safety perception comes from the NYC Citywide Mobility Survey
• Cyclist risk is measured as cyclists killed or seriously injured per 10 million cyclist trips in NYC, data given by NYC DOT
• Currently looking for data sets that cover safety perception during 2020-2021, CMS does not include cycling safety perception questions in the 2020 survey
Significance
• Clear disconnect between effectiveness of bicycle infrastructure and public perception of cycling safety
•Potentially revealing of how safety features impact (or fail to impact) different demographics within NYC
• Investigate safety perception amongst different demographic groups (i.e., high-income vs low-income cyclists)
------------------------------------------------------------------------------------------------
Center for Geological and Climate Hazards
Interdisciplinary Research Experience for Undergraduates in Atmospheric and Geological Hazards
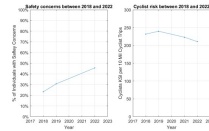

Even though cyclists killed or seriously injured has remained steady and even decreased in recent years, perception of cycling danger has been rising