Runoff Ratios in a Warming Arctic Using Climate Models for the Alaska-Yukon River Basin Region
By: Nathaniel Flores, Williams College
Advisor: Yifan Cheng, PhD, Department of Earth Science, University at Buffalo
Project Objectives
• A warming Arctic has resulted in a changing runoff to precipitation ratio (how efficiently precipitation is converted into runoff), but the effects are unknown
• Assessed the changes in surface hydrology that lead to this outcome and attempt to determine how this will affect the climate in two future modeled scenarios
Data and Results
• In general, results were discovered to be significantly regional, with each regional climate seeing significant yet disparate impacts
• R-P ratio significantly declined in summer months and increased significantly in the wintertime, indicating that more melting takes place in the winter
• More melting and runoff is possible in the winter due to widespread melting of permafrost, which results in a warmer ground temperature and raises the maximum possible groundwater volume. This results in more groundwater movement in winter
• Snow water equivalent decreases over time and snowmelts usually happens earlier in the year, resulting in smaller spring snowmelt, especially when coupled with the changes in groundwater
Significance
• These results suggest that water management will become more complicated and traditional sources, such as spring snowmelt, will shrink in size
• The extreme regionality within the dataset suggests that future analyses in this region would benefit from a more regional approach
Publication or Conference
Flores, N., Cheng, Y., 2025. What drives the change of runoff-to-precipitation ratio in Alaska? An insight from a newly developed modeling dataset. Presented at the AGU25: https://agu.confex.com/agu/agu25/prelim.cgi/Paper/1874057.
------------------------------------------------------------------------------------------------
Center for Geological and Climate Hazards
Interdisciplinary Research Experience for Undergraduates in Atmospheric and Geological Hazards

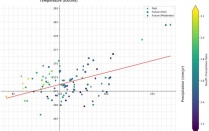
Runoff to precipitation ratio as shading for a graph of summer temperature and precipitation for the Northern Slope region; each dot is one year. Over time, R-P ratios decline as temperature and precipitation increase, like in most regions.