Spatial Analysis and Visualization of Bicycle Crashes and Equity in NYC
By Mia Maines, University at Buffalo
Advisors: Irina Benedyk, Department of civil engineering, University at Buffalo
Advisors: Stuart Evans, GEOGRAPHY, University at Buffalo
Project Objectives
•Map distribution of bicycle crashes
•Refine and quantify bicycle equity and safety metrics
•Compare spatial distributions of chosen metrics to crash distribution
Data and Results
• Spatial datasets from Census, NYCDP, crash data from NYPD
•Baseline equity index, bicycle crash stress, crashes per tract calculated
•Pearson and Lee’s L correlation calculated between metrics
•Pearson results insignificant
•Lee’s L identified clusters of high local correlation in Harlem and Central Brooklyn
Significance
•High local spatial correlation in these areas (Harlem, Central Brooklyn) indicates these areas are burdened by high crashes, high bicycle stress, and high underserved/transit-reliant population
•These areas indicate potential prioritization by policy-makers
•Future steps include introducing traffic stress variables
Publication or Conference
Maines, M, I. Benedyk, Y. Wang, A. Crooks, A. Angulo, 2026. Spatial Analysis and Visualization of Bicycle Crashes, Biking Level of Traffic Stress, and Bicycle Equity Index in New York City. TRB.
------------------------------------------------------------------------------------------------
Center for Geological and Climate Hazards
Interdisciplinary Research Experience for Undergraduates in Atmospheric and Geological Hazards

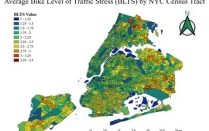
This map shows the modeled BLTS for each census tract in NYC. BLTS is the modeled “stress” (perceived difficulty, danger) for cyclists, based on speed limit, number of car lanes, and bike lanes