Campus News
As fall colors blanket WNY, UB class observes trees for national program

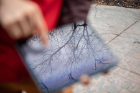
Trang Le examines a a staghorn sumac tree. Photo: Douglas Levere
By CHARLOTTE HSU
Published November 7, 2019 This content is archived.
Under a silver sky, on a quiet patch of earth by Lake LaSalle, UB freshman Trang Le examines a small tree.
The specimen, a staghorn sumac, is petite compared to majestic oaks and willows that rise nearby. But it commands her attention.
This is Le’s tree — one of four she’s monitoring this semester through the “Earth, Environment and Climate Laboratory,” an undergraduate course led by Adam Wilson in the Department of Geography and taught by graduate teaching assistants.
As part of the class, students are becoming citizen scientists. They’re sending weekly observations of campus trees to the USA National Phenology Network, a program that invites volunteers, educators and other partners to track the timing of ecological events across the U.S. (Phenology is the study of seasonal and cyclical variations in natural phenomena, such as flowers blooming or birds building nests.)
Wilson is asking students to monitor leaf loss and color change, with an option to also submit information on other traits, such as fruit maturity and fruit/seed droppage. The undergraduate researchers have made more than 19,000 observations so far.
The effort marks the start of a long-term project to track ecological events on campus, and to share data with a national initiative. Information from the network is used by scientists to research how nature responds to changing conditions.
“This is the first semester of this project, and I plan to continue this in future years, so we’ll soon have a massive dataset to look at how the plants (and later, animals) on campus respond to climatic variability,” says Wilson, a biogeographer and assistant professor of geography in the College of Arts and Sciences. “The data collected through the National Phenology Network can be used to improve national models of phenological variability, and are freely available to researchers. These data have been used in many scientific papers, including my own.”
Photos: Douglas Levere
Leaf loss as an annual, global event
About 200 students in Wilson’s course are together monitoring 100 trees near the Ellicott Complex.
There are sugar maples, honey locusts, maidenhairs and Eastern cottonwoods — the list goes on. Each undergraduate has been assigned to observe four specific trees once a week, with multiple students tracking the same individuals to gather repeat observations.
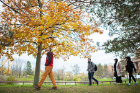
As Le examined her staghorn sumac in early November, many trees around the Ellicott Complex were nearly bare, their naked branches reaching up toward gray autumn skies. When the rest follow suit and shed their foliage, each leaf that drops — however small — will be part of an annual, global event.
“Worldwide, the signature of falling leaves is apparent in the seasonal variability of carbon dioxide in the atmosphere,” Wilson says. “When the trees in the Northern Hemisphere lose their leaves, they stop removing CO2 from the atmosphere and global CO2 increases, adding to emissions created by human activity. It might seem insignificant, but the timing of spring leaf out and fall senescence is an important factor in the global carbon cycle.
“Our students are learning, firsthand, how very local processes — such as when one of ‘their’ trees loses its leaves — scale up to impact global phenomenon.”

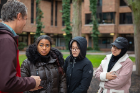
From left: Christin Bratton, an undergraduate in environmental studies; David Torgerson, a master’s student in management information systems who is not in the class but is working on a related project; Adam Wilson, assistant professor of geography; Shaima Abughanem, an undergraduate in environmental design; and Trang Le, an undergraduate in economics. In the background is a mix of red and black oak trees. Photo: Douglas Levere
UB as a wild place
The tree-monitoring endeavor brings together a diverse crew.
Christin Bratton, a junior in environmental studies, is excited to contribute to science by conducting research outdoors.
David Torgerson, a master’s student in management information systems in the School of Management, is not a member of the class. But he’s enrolled in a spatial data science course that Wilson is teaching, and as part of that, Torgerson is building a visualization tool that will let users view data for individual trees at UB.
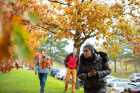
For everyone, the tree lab is a chance to experience the campus as an ecosystem, a place animated by plants and wildlife, with patterns of movement and activity that change with the seasons and the passage of time.
The students have been tracking the trees all semester, watching as the leaves turn from lush shades of green to a rainbow of autumn colors — muted golds, brilliant oranges, reds as striking as the feathers of a cardinal. Recent windstorms left a mark as well, stripping many branches of their foliage and toppling majestic willows by Lake LaSalle in the area where the class is working. The students’ data will capture some of those changes.
“I am from a tropical area,” says Le, an international student majoring in economics in the College of Arts and Sciences. “I live in the south of Vietnam, so there’s no ‘winter.’ This is my first winter in Buffalo, and I can observe that the trees are changing. It’s quite interesting.”
Data collected through the UB course can be viewed using the National Phenology Network’s online visualization tool.