Study: Mapping 16 years of ice sheet loss

Illustration showing ICESat-2 above the Earth. Credit: NASA's Goddard Space Flight Center. Available for download at https://svs.gsfc.nasa.gov/11712#20755.
UB climate scientist Beata Csatho contributed to a multi-institution study that used NASA space laser missions to measure ice loss from Greenland, Antarctica
Release Date: April 30, 2020


BUFFALO, N.Y. — University at Buffalo climate scientist Beata Csatho is co-author of a new study that makes precise, detailed measurements of how the Greenland and Antarctic ice sheets have changed over 16 years.
The research employed insights from NASA’s Ice, Cloud and land Elevation Satellite-2 (ICESat-2), the most advanced Earth-observing laser instrument NASA has ever flown in space. From 2011-14, Csatho led the Science Definition Team that helped determine the satellite’s scientific requirements, such as the precision of the laser-based research instrument on board.
The new study, published online in Science on April 30, provides insights into how polar ice sheets are changing, demonstrating that small gains of ice in East Antarctica are dwarfed by massive losses in West Antarctica.
The research found that the net loss of ice from Antarctica, along with Greenland’s shrinking ice sheet, have been responsible for 0.55 inches (14 millimeters) of sea level rise between 2003 and 2019 — slightly less than a third of the total amount of sea level rise observed in the world’s oceans.
“ICESat-2 allows us to accurately capture subtle but important elevation changes in the vast interior of the ice sheets, a feat that was too difficult for earlier satellite missions,” says Csatho, PhD, chair and professor of geology in the UB College of Arts and Sciences. “Moreover, we obtained accurate measurements of changes in the rugged coastal regions as well. As ICESat-2 continues to collect data, we will be able to estimate ongoing changes and compare those with the 16-year averages presented here to further investigate the impact of climate on the ice sheets.”

Infographic illustrating the major technology and science objectives of the Ice, Cloud and land Elevation Satellite-2. Credit: NASA's Goddard Space Flight Center. Available for download at
https://svs.gsfc.nasa.gov/13068.
https://svs.gsfc.nasa.gov/13068.
“If you watch a glacier or ice sheet for a month, or a year, you’re not going to learn much about what the climate is doing to it,” says Ben Smith, a glaciologist at the University of Washington and lead author of the new paper. “We now have a 16-year span between ICESat and ICESat-2 and can be much more confident that the changes we’re seeing in the ice have to do with the long-term changes in the climate.”
The findings relied on data from ICESat-2, which launched in 2018 to make detailed global elevation measurements, including over Earth’s frozen regions. By comparing the recent data with measurements taken by the original ICESat from 2003 to 2009, researchers have generated a comprehensive portrait of the complexities of ice sheet change and insights about the future of Greenland and Antarctica.

The final United Launch Alliance Delta II rocket lifts off from Space Launch Complex 2 at Vandenberg Air Force Base in California, on Sept. 15, 2018, carrying NASA's Ice, Cloud and land Elevation Satellite-2 (ICESat-2). Credit: NASA/Kim Shiflett. Available for download at on NASA Kennedy's Flickr page.
The study found that Greenland’s ice sheet lost an average of 200 gigatons of ice per year, and Antarctica’s ice sheets lost an average of 118 gigatons of ice per year. One gigaton of ice is enough to fill 400,000 Olympic-sized swimming pools or cover New York’s Central Park in ice more than 1,000 feet (300 meters) thick, reaching higher than the Chrysler Building.
Csatho — one of hundreds of scientists and engineers who worked on the ICESat-2 mission — attended the satellite’s launch at Vandenberg Air Force Base in California in September 2018.
ICESat-2’s instrument is a laser altimeter, which sends 10,000 pulses of light in a second down to Earth’s surface, and measures how long it takes for tiny particles of light (photons) to return to the satellite. The measurements of time are highly precise — better than a billionth of a second, Csatho says — and this allows scientists to determine how much an ice sheet changes over a year to within an inch.
A detailed picture of how ice is changing in Antarctica and Greenland

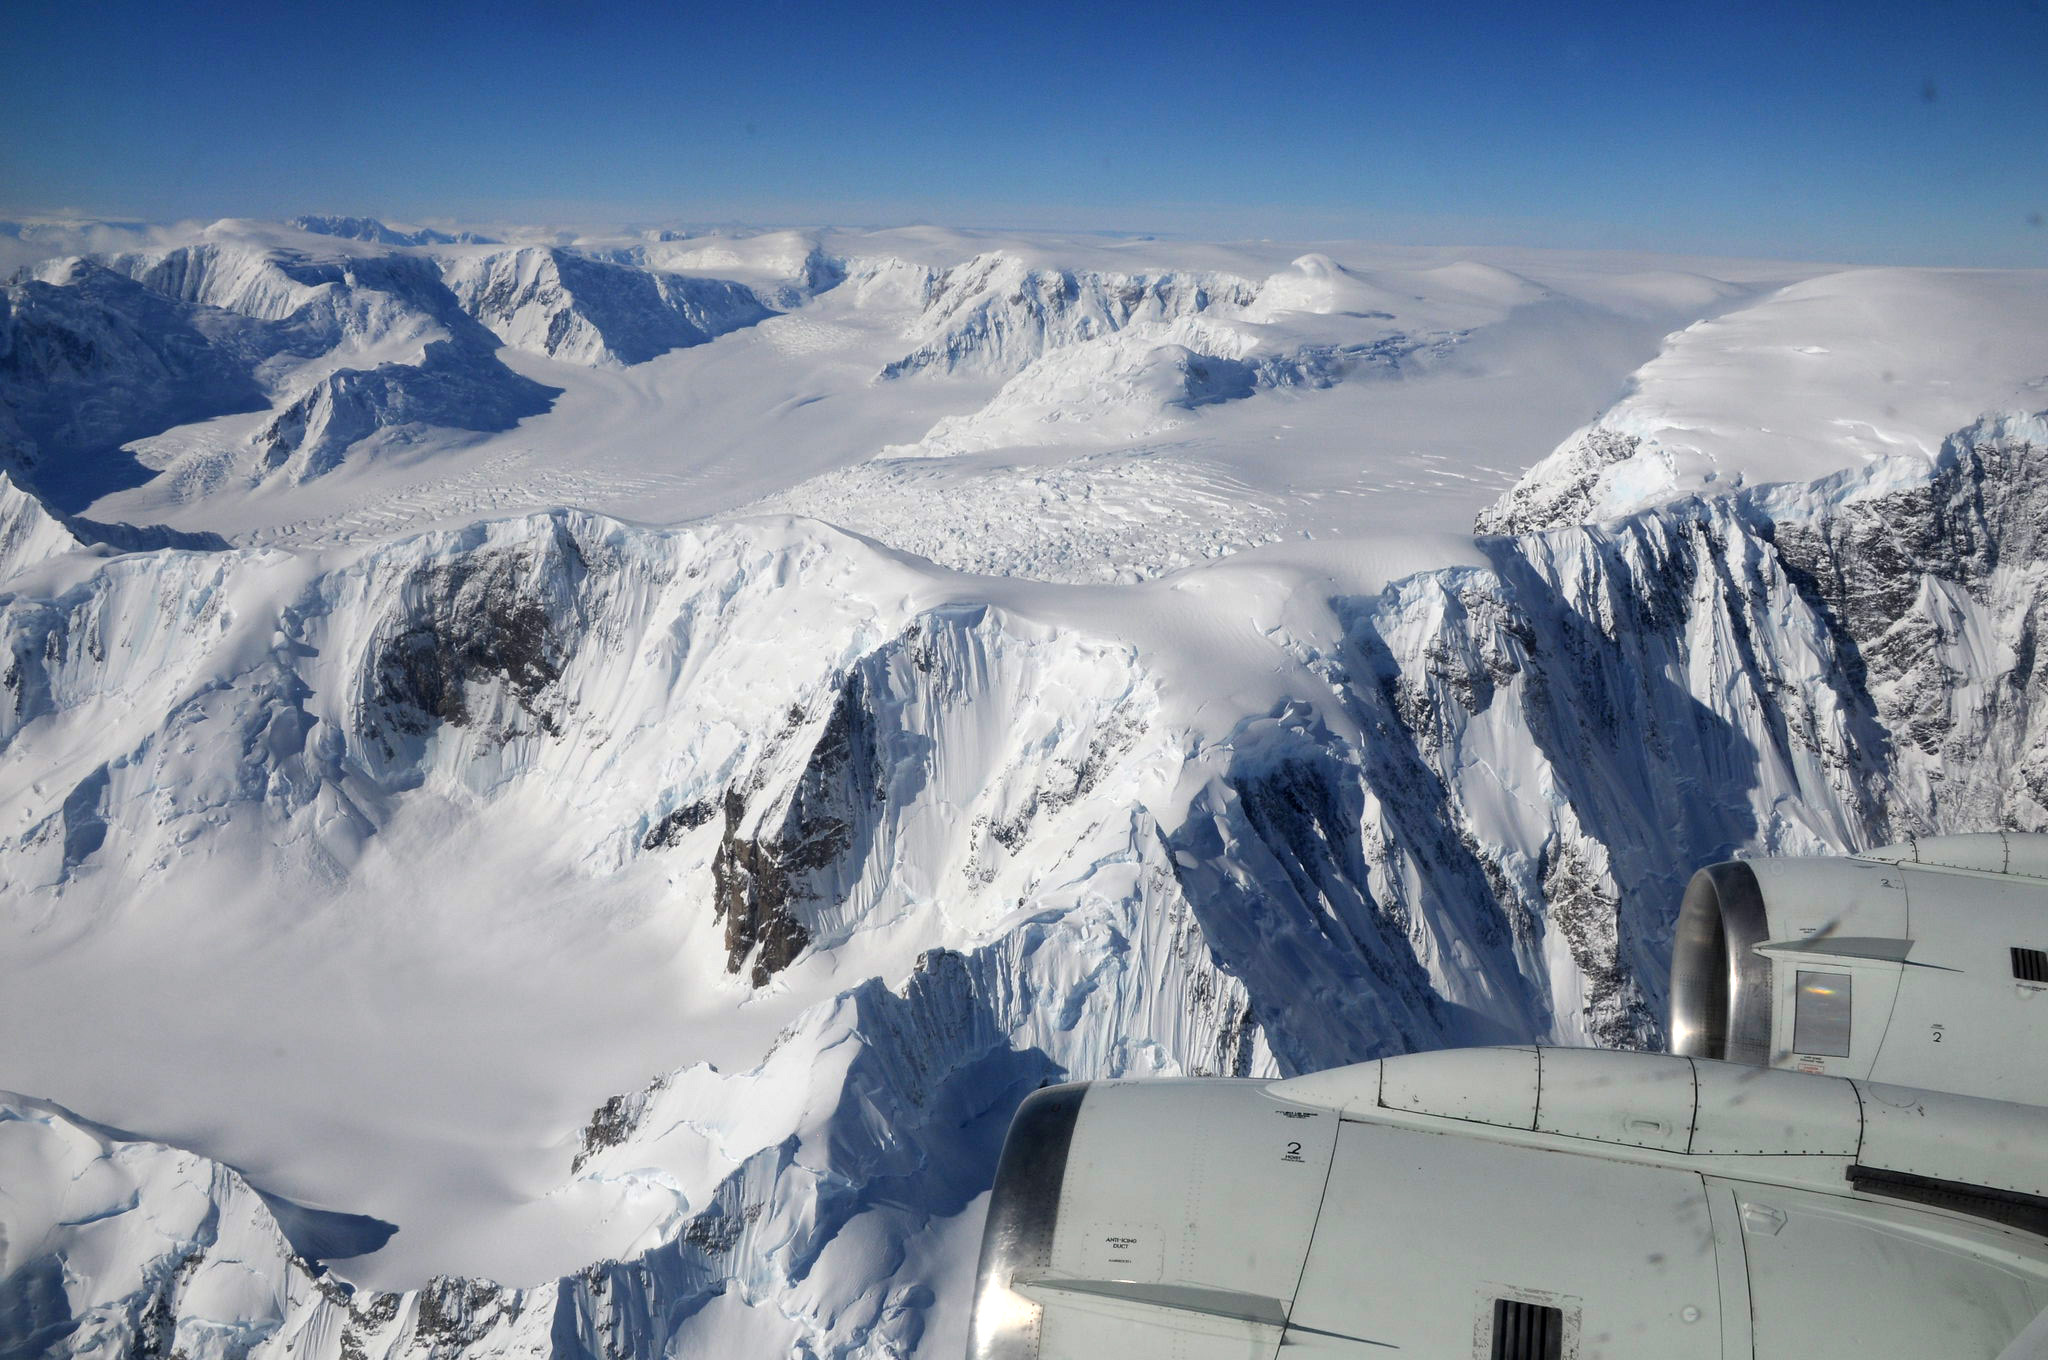
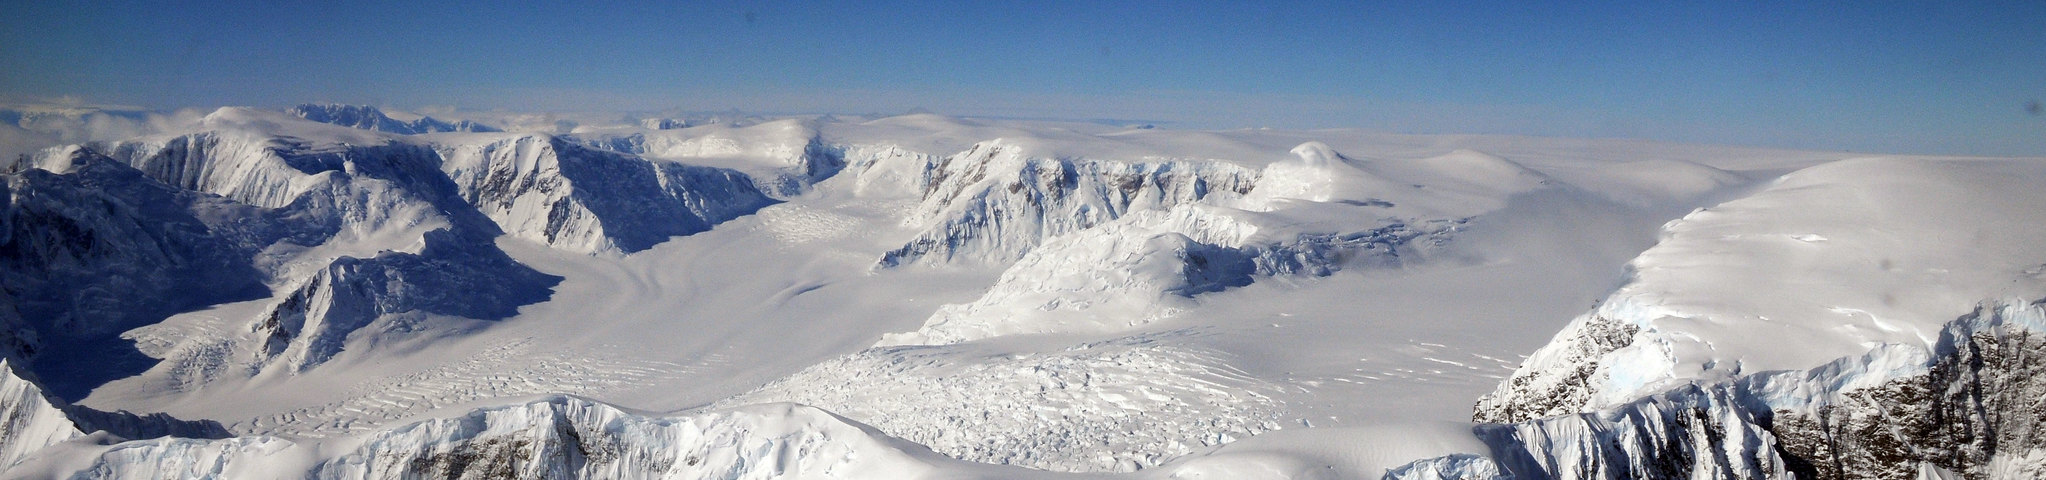
Antartica, as viewed through the window of an airplane. Credit: Tony Schenk. Available for download on Beata Csatho's Flickr page.
In Antarctica, detailed measurements showed that the ice sheet is getting thicker in parts of the continent’s interior as a result of increased snowfall, according to the study. But the loss of ice from the continent’s margins, especially in West Antarctica and the Antarctic Peninsula, far outweighs any gains in the interior. In those places, the loss is due to warming from the ocean, scientists say.
In Greenland, there was a significant amount of thinning of coastal glaciers, Smith says. The Kangerdlugssuaq and Jakobshavn glaciers, for example, have lost 14 to 20 feet (4 to 6 meters) of elevation per year. Warmer summer temperatures have melted ice from the surface of the glaciers and ice sheets, and in some basins, the warmer ocean water erodes away the ice at their fronts.
The study also examined ice shelves — the floating masses of ice at the downstream end of glaciers. These ice shelves, which rise and fall with the tides, can be difficult to measure. Some have rough surfaces, with crevasses and ridges, but the precision and high resolution of ICESat-2 allows researchers to measure overall changes.
The study found ice shelves are losing mass in West Antarctica, where many of the continent’s fastest-moving glaciers are located as well. Patterns of thinning over the ice shelves in West Antarctica show that the Thwaites and Crosson ice shelves have thinned the most, an average of about 16 feet (5 meters) and 10 feet (3 meters) of ice per year, respectively.
In the same way that the melt of ice cubes in a full cup of water doesn’t overflow the glass, ice that melts from ice shelves isn’t thought to contribute much to sea level rise since the ice is already floating. But the ice shelves do provide stability for the glaciers and ice sheets behind them.

Antartica, as viewed through the window of an airplane. Credit: Tony Schenk. Available for download on Beata Csatho's Flickr page.
Media Contact Information
University at Buffalo:
Charlotte Hsu is a former staff writer in University Communications. To contact UB's media relations staff, email ub-news@buffalo.edu or visit our list of current university media contacts.
NASA's Goddard Space Flight Center:
Kate Ramsayer
Science Writer/Outreach Coordinator
NASA's Goddard Space Flight Center
kate.d.ramsayer@nasa.gov