Climate Group Research
Look out Greenland, UB climate faculty are on to you!
Climate group faculty recently expanded with the hiring of Sophie Nowicki, coming from NASA-Goddard. We now comprise Geology professors Thomas, Poinar, Nowicki, Csatho, Briner and Schenk, and Geography professor and friend-of-geology Evans.
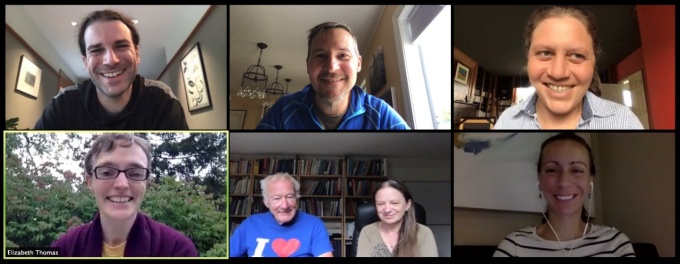

UB Climate and Ice Sheets group, clockwise from upper left: Stuart Evans, Jason Briner, Sophie Nowicki, Kristin Poinar, Bea Csatho, Tony Schenk and Elizabeth Thomas.
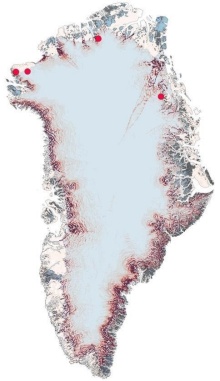
Although collectively we work all over the world and on a large variety of problems in Earth Science, the lens of much of our work is focused on Greenland. As a team, now under one roof, collaboration and synergy is easier than ever. We already have grantsfor climate-, and specifically, for Greenland-focused research. These projects include multiple members from our group, and we anticipate that climate-group collaboration will continue to expand.Examples of ongoing projects include: (1) Producing the first-ever record of terrestrial temperature on Greenlandspanning the past eight glacial-interglacial periods; (2) Predicting the locations where future surface meltwater will get to the base of the Greenland Ice Sheet;(3) Combining remote sensingobservations and modeling of ice sheets for improving the understanding of ice sheet dynamics and projecting sea level change; (4) Drilling through the northern Greenland Ice Sheet to obtain bedrock samples from the ice-bed interface, information from which will yield records of long-term ice-sheet history. We next describe each of our ongoing research in more detail:
Elizabeth Thomas, Assistant Professor
My team (including lab tech Owen Cowling (UB Geology MS ‘18), PhD students Allison Cluett, Devon Gorbey, Sofia Kjellman, and Kurt Lindberg, MS students Arden Croft and Kayla Hollister, and undergraduate student Katie Lovell) reconstructs past temperature and precipitation using lipid biomarkers and stable isotopes. Our research has grown thanks to collaborations with the UB climate group, including Evans (atmospheric moisture tracking to interpret precipitation stable isotopes) and Briner (led development of the first Holocene-to-future record of Greenland Ice Sheet melt, published in NatureOctober 1, 2020). I am leading a new project with researchers at Northern Arizona University. We will use paleoclimate data generation, big data synthesis, and climate models to understand the mechanisms causing Arctic climate change during past rapid warming events. These events are analogs for ongoing and future change in this bellwether region of global climate. I am also excited to teach GLY479/579: The Carbon Reduction Challenge, for the third year. This class focuses on a project in which teams of UBstudents conduct a carbon footprint analysis and develop a Climate Action Plan for a local business or not-for-profit. In the past two years, the course has avoided over 2 million pounds of CO2emissions (equivalent to annual emissions from 20 average US households) and provided networking opportunities for students seeking jobs.
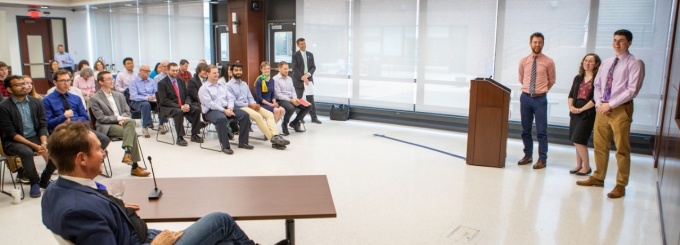

Students from GLY479/579: The Carbon Reduction Challenge presenting to Congressman Higgins (seated, foreground) and the UB community on Earth Day, 2019. (students presenting L to R: Jeremy Stock, Geology BS ’18 MS ’20; AmyGrogan, Geology MS ’20; Quinn Keenan, Engineering MS ’19)
Kristin Poinar, Assistant Professor
Poinar’s new field and modeling project will answer the questionhow often does water in Helheim Glacier’s aquifer drain to the bed?This affects the speed of ice flow within the entire glacier and, in turn, global sea-level rise.The project involves undergraduate, graduate, and postdoctoral researchers (UB names here?) who will combine intensive field observations and custom models to understand the behavior of huge crevasses directly downstream of an englacial aquifer.These efforts will determine time-dependent fluxes of water to the bed of Helheim Glacier.We hypothesize that these are highly variable in time and may range from zero water to a sudden-onset flood that may occur multiple times per year.The team will travel to Southeast Greenland each summer from 2021 through 2023 to make these measurements.
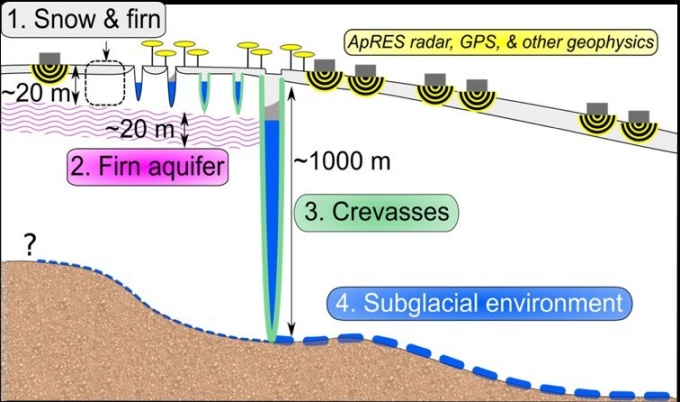

Schematic of Poinar’s field location on Helheim Glacier, Southeast Greenland. The research team will investigate how meltwater trickles down through the snow (gray) to reach the firn aquifer (pink), from where it flows into crevasses (green) and may cause them to hydrofracture to the bed (blue).
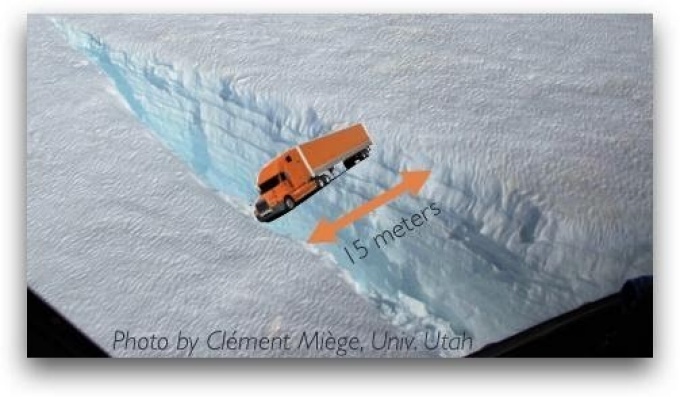

Air photo of a crevasse that likely connects the firn aquifer to the bed on Helheim Glacier. This crevasse is 15 meters wide at the surface. Photo by Clément Miège, University of Utah, in a 2015 field campaign.
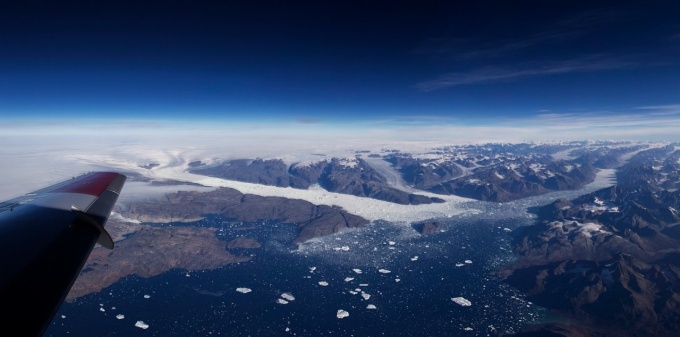

Air photo of the Helheim Glacier system in Sermilik Fjord, southeast Greenland. Poinar’s field area is at the tip of the airplane wing. Photo by Jeremy Harbeck, NASA GSFC.
Stuart Evans, Assistant Professor (Geography)
My current research uses both global climate models and satellite observations to study the effects of desert dust on the climate of North Africa and the Sahel region in particular. By absorbing and scattering incoming sunlight, dust alters the energy balance of the atmosphere and reduces the rainfall the region receives, reducing plant growth and exacerbating droughts. I am also interested in how the loss of rainfall can create a feedback loop between increasing desertification and increasing dust. In addition to altering precipitation patterns and surface temperature, dust is a key nutrient supply for much of the biosphere, and provides records of paleoclimate in ice and sediment cores. Dust also matters in human environments, where it is a hazard to both health and transportation.
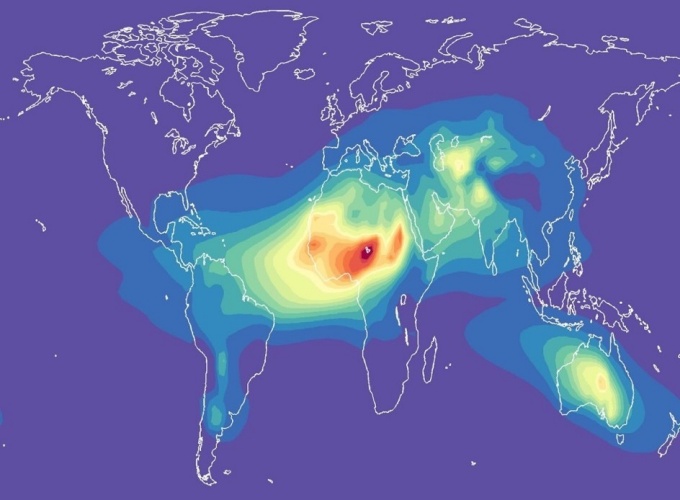

The distribution of desert dust in the atmosphere, simulated by the CM3 global climate model.
Sophie Nowicki, Professor
Nowicki just joined UB Geology and is looking forward to advising students and collaborating within the UB climate group. Her work is driven by the desire to understand the current state of the Greenland and Antarctic ice sheets, as well as their potential evolution and contribution to sea level rise. She predominantly uses large scale ice sheet models and remote sensed observations, but is also interested in improving climate models in the polar regions because these atmospheric and oceanic drivers will ultimately decide the fate of the ice sheets.
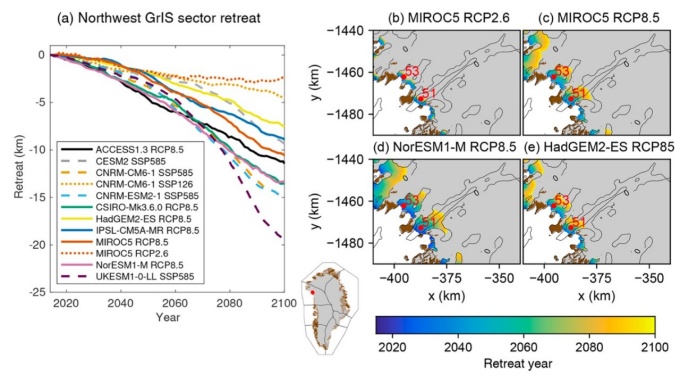

Since climate models do not currently simulate ocean circulations in the fjords of the Greenland ice sheet, ice sheet modelers need to find alternative ways to estimate how warming oceans will impact the ice sheet. Here, ice-ocean interactions are represented by an oceanic retreat that need to be imposed to ice sheet models as part of the Ice Sheet Model Intercomparison Effort for CMIP6 (ISMIP6). a) Time series of oceanic retreat over the 21st century due to selected climate models and future climate scenarios. (b-e) Example of corresponding imposed oceanic retreat from 2015 to 2100. Gray indicates ice sheet masks, and bedrock topographic contours in shown as black lines.
Bea Csatho, Professor and Chair
Csatho’s research group (David Narkevic, PhD, Hui Gao and Jordan Davern, MS students and Ivan Parmuzin, GIS specialist) is using the 40 year-long elevation change record of Greenland to understand the Greenland Ice Sheet’s dynamic response to atmospheric and oceanic warming. The detailed reconstructions reveal exciting details about the break-up of Greenland ice tongues buttressing glaciers in northern Greenland, the rapid thinning of the Jakobshavn Glacier following the 2012 extensive melt and the reconfiguration of outlet glaciers on a decadal time scale. The group is especially excited about incorporating ICESat-2 observations to densify and extend the altimetry record and derive seasonal elevation changes. Collaborating with Schenk and Nowicki, Csatho will also extend the timeline into the past by using DEMs from historical aerial photograph to reconstruct the Greenland Ice Sheet during the equilibrium period in the 1980s.
Tony Schenk, Research Professor
My research is related to ICESat-2, NASA's innovative single photon counting laser altimetry system. Together with Csatho we are currently working on calibration/validation aspects of ICESat-2 with the goal to assess the horizontal accuracy and precision of the system. We selected the terrain-matching method to determine the position of a laser altimeter profile within a natural surface, represented by a DEM. We took this classical approach a step further by calculating the optimal position of the laser profile by a least squares adjustment. We found the highly accurate DEMs of the Dry Valleys, Antarctica, ideal for this research because of their stable landscape and rugged topography.
Another aspect of my current research is expanding SERAC (Surface Elevation Reconstruction And Change detection) to include laser points derived from observations from ICESat-2. This makes it possible to extend time series of elevation changes until the present. Moreover, I have also modified the system to cope with other than laser data, most importantly by including DEMs. Thus, SERAC has become a true fusion system where data from different sources are uniquely combined by a simultaneous adjustment.
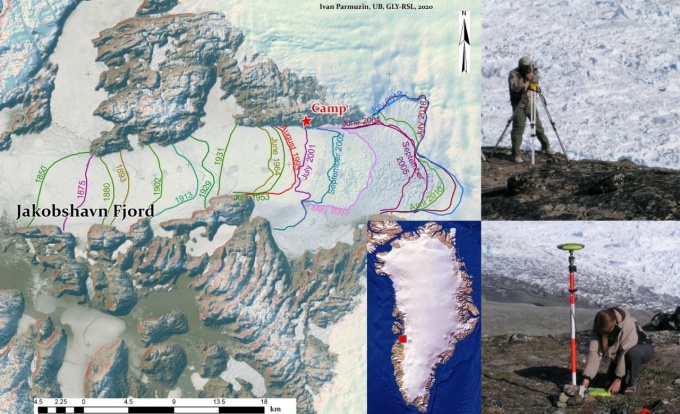

Combination of remote sensing, in situ measurements, and historical data provides a comprehensive history of outlet glacier retreat and thinning; Jakobshavn Glacier in west Greenland, one of the fastest flowing glaciers of the world. Left panel: calving front retreat history; upper right panel: surveying icebergs in the fjord (Toni Schenk); lower right panel: establishing a GPS base station for surveying marginal retreat and elevation change (Bea Csatho). Pictures are from 2003 near a camp north of Jakobshavn Fjord (“Camp”).
Jason Briner, Professor

– Briner’s team (PhD students Joe Tulenko and Brandon Graham, and MS students Caleb Walcott and Karlee Prince) focuses on reconstructing Pleistocene glacier history in Alaska and Holocene and longer ice sheet history in Greenland. He’s currently advising four graduate students (two PhD students and two MS students) who have field areas in Alaska, Colorado, Greenland and western New York. He’s particularly excited about a new project to obtain rock samples from beneath the ice sheet in northern Greenland, which requires extensive logistical planning for drilling into ice and then continuing into rock once the drill gets to the ice bed. The work builds on UB’s legacy in drilling ice cores on Greenland, dating back to the mid-70s when UB Geology hired Chet Langway, who already was an established ice core scientist. He later became the lead US PI in the Greenland Ice Sheet Project (GISP), known as the DYE-3 ice core. That UB Geology is back drilling through Greenland ice is pretty exciting, even if the focus now is on what lies beneath. Briner’s work is already benefiting from collaboration within the UB climate group – Poinar has recently lent a hand with her expertise in Greenland crevasse mapping to guide Briner’s group in identifying safe drill sites.
Volcanology Research
Digging ash at Ubehebe volcano, Death Valley
Greg Valentine
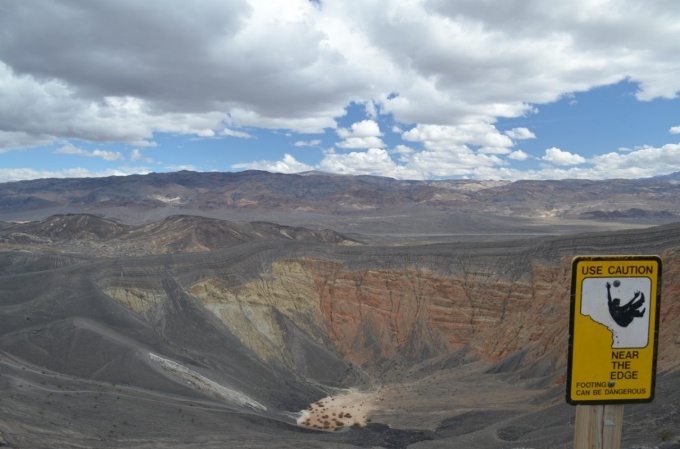

Figure 1. A view across Ubehebe crater (don’t fall in!). There is a small playa (dry lake bed) at the bottom of the crater, while orange and yellow layered rocks are actually the pre-eruption “bedrock” that was exposed by crater excavation. These are draped by gray ejecta deposits.
A couple of years ago I received an email from Judy Fierstein, a colleague at the USGS California Volcano Observatory (CalVO), asking if I’d like to join her and another long-time colleague of mine, James White from University of Otago (New Zealand), in a project aimed at understanding the eruptions of Ubehebe volcano, in Death Valley. I like that type of email – an opportunity to work in the desert on a volcano, two of my favorite things! Since that initial email we’ve had two field sessions in Death Valley. Although we’re not done yet, we’ve already learned some very interesting things and two of our UB graduate students have been able to gain experience while getting to network with two of the top field volcanologists in the world.
According to information from Death Valley National Park, Ubehebe (pronounced like you-be-he-be) is a Paiute word that was originally the name of a desert peak in a nearby mountain range. The Shoshone people, who occupied the Great Basin, used a different name for the volcano: Tem-pin-tta-Wo’sah, which translates to English as “coyote basket.” It’s not known how the crater came to be referred to as Ubehebe, but the Shoshone term is quite fitting, since the dominant feature of the volcano is a 150 m deep, 800 m wide crater that is cut into the pre-existing landscape (Figure 1); it’s a basket-shaped hole, instead of the mountain that usually comes to mind when we think of volcanoes. This type of volcano is called a maar, and forms when rising magma, with temperatures of about 1100 °C (2020 °°F), mixes in just the right way with groundwater to produce violent vapor explosions. (This process, called phreatomagmatism, is a major topic of research in our department, led by experimental studies under Ingo Sonder, PhD. It is similar to deadly industrial explosions at steel mills when water and molten metals come into contact in certain ways.) It seems odd to think about water in the hyper-arid setting of Death Valley, but there is groundwater there that is fed by snow and rain in surrounding mountains (a lot of that groundwater is probably Pleistocene in age!).
Ubehebe volcano actually has a number of craters, with Ubehebe crater itself having been produced by the final, and most violent, series of explosions. All of these craters formed during a relatively short interval, probably a few weeks long, around 2000 years ago. The explosions brecciated the country rocks (the red and yellow rocks exposed in the crater wall) and, along with fragments of solidified basaltic magma, threw them out of the crater. Close to the crater, the ejecta was deposited coarse fragments mainly by “ballistic” processes, but with increasing distance, the ejecta formed dense, turbulent clouds of ash and gases (steam plus air) that rolled out across the landscape like super-intense sandstorms or haboobs. These flows are referred to as pyroclastic surges, and they are extremely hazardous due to their high concentrations of fine particles (ash), potentially high temperatures, and high velocities. For example, most of the fatalities at Pompeii, during the AD 79 eruption of Vesuvius, resulted from pyroclastic surges that preceded the much more concentrated flows that buried the town.
The movement of pyroclastic surges depends upon initial velocity, the supply of ash to the surge and its loss through sedimentation, mixing with surrounding air, and topography. Although we understand these controls at a conceptual level, much remains to be quantified about the details, which in turn are needed in order to develop predictive models for emergency planning. Clues to many of these details are recorded in the deposits left behind, which have many interesting characteristics such as dunes. Ubehebe is an excellent place to study these because of the relatively young age of the deposits and their excellent preservation and exposure in the desert environment.
Our approach to studying these deposits borrows much from classical sedimentology. We spend a lot of time at individual outcrops and pits, documenting and measuring layers, dunes, particle sizes, and so forth. Samples are taken and lugged back to the UB Volcanology Lab where we determine the particle size distributions (through good old-fashioned sieving – remember that from your undergrad days?) and the types of clasts in each size fraction. Ultimately these data will be used to guide inputs for complex fluid dynamics models, with the goal of determining what eruption and flow conditions are needed in order to produce a given set of observations.
The Ubehebe deposits extend more than 5 km (3 miles) in all directions around the volcano, and to date we’ve studied more than 100 outcrops and pits. The work is still in its early stages, with one or two field seasons remaining to be done, but already we’ve learned some very interesting things. For example, we have strong evidence that rapid deposition from surges onto the steep slopes of surrounding hills resulted in concentrated, granular flows that then moved separately downslope and ran out onto surrounding plains for distances of at least a kilometer. This process could have an impact on our predictive models of hazards.
Ubehebe surge deposits are famous for their soft sediment deformation structures, which have a range of forms including crazy-complex folds and small thrust faults. A traditional explanation of such features is that the deposits were damp and cohesive, and deformed plastically as they slumped down slopes. This in turn leads to inferences that the pyroclastic surges were cool enough to contain liquid water droplets; obviously the hazards of a surge would be different if it is cool versus hot. However, our work indicates that the soft sediment deformation at Ubehebe took place in a dry state, thus complicating how we interpret their parent surges as hot or cold. This work was recently published in Geology and I’d be happy to share it with any readers – just send an email to gav4@buffalo.edu.
Two of our graduate students, Meredith Cole (PhD candidate) and Patrick Bobbitt (MS candidate), have assisted in the fieldwork, learning about detailed stratigraphy of pyroclastic deposits and just how dirty we can get in a day’s work (Figure 2). We’re spoiled at Ubehebe because the best option for sleeping arrangements is a hotel about 40 miles away; this means we get to shower the ash away at the end of each workday. Meredith is using the skills learned at Ubehebe in her own studies of deposits from super-eruptions in New Mexico and Colorado, and is coming up with new insights into processes of those gigantic eruptions. Pat is translating some of the methods into his own work at a scoria cone that erupted through older pyroclastic deposits in New Mexico.
Once field studies are complete, we’ll start transitioning into the numerical modeling side of the work. Incoming faculty member Mattia de’Michieli Vitturi, PhD, who is one of the top modelers of volcanic processes in the world, will be heavily involved in that. We have also proposed a larger project on pyroclastic surges with collaborators at Arizona and Boise State Universities; if this is funded by the National Science Foundation, we will be doing more fieldwork at more sites, and more students will be brought into these interesting studies.
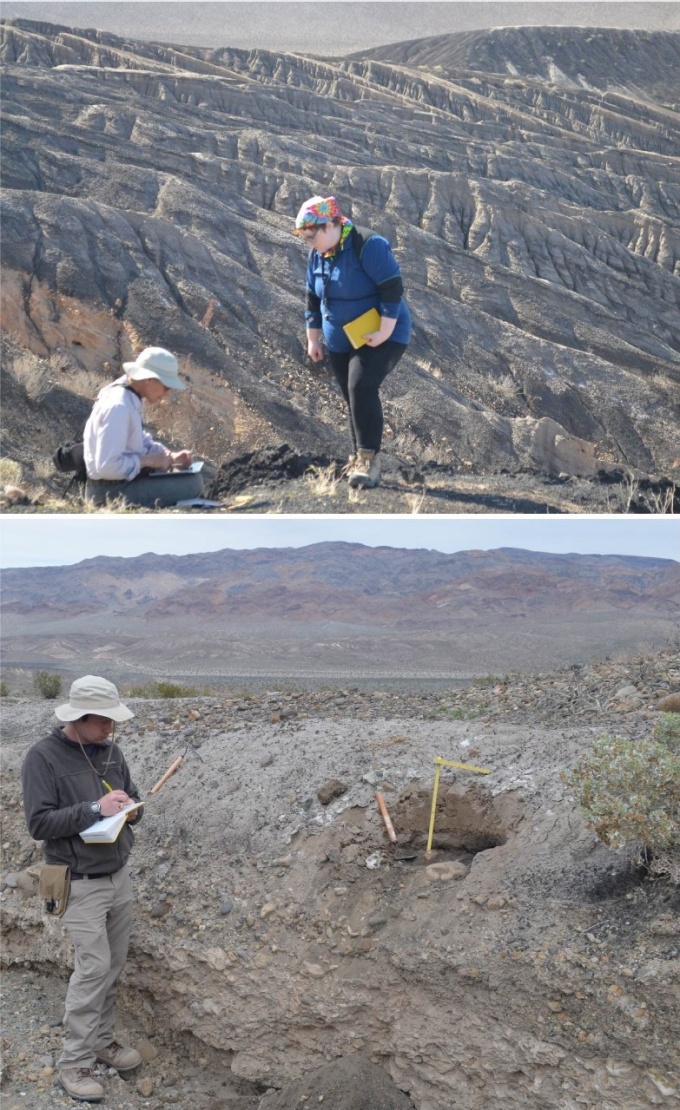

Figure 2. Top –PhD candidate Meredith Cole (standing) works with USGS geologist Judy Fierstein to document a large (3 m!) volcanic bomb found some distance from its source crater. Bottom –MS student Patrick Bobbitt documents Ubehebe ash deposits overlying fanglomerate.